There are lots of Power loggers out there. Either they allow you to see your live status on a LCD or logs the data to a SD card. If you want to see it live, and want to be able to receive the logs live, there isn’t much on the market.
My Requirements to be solved:
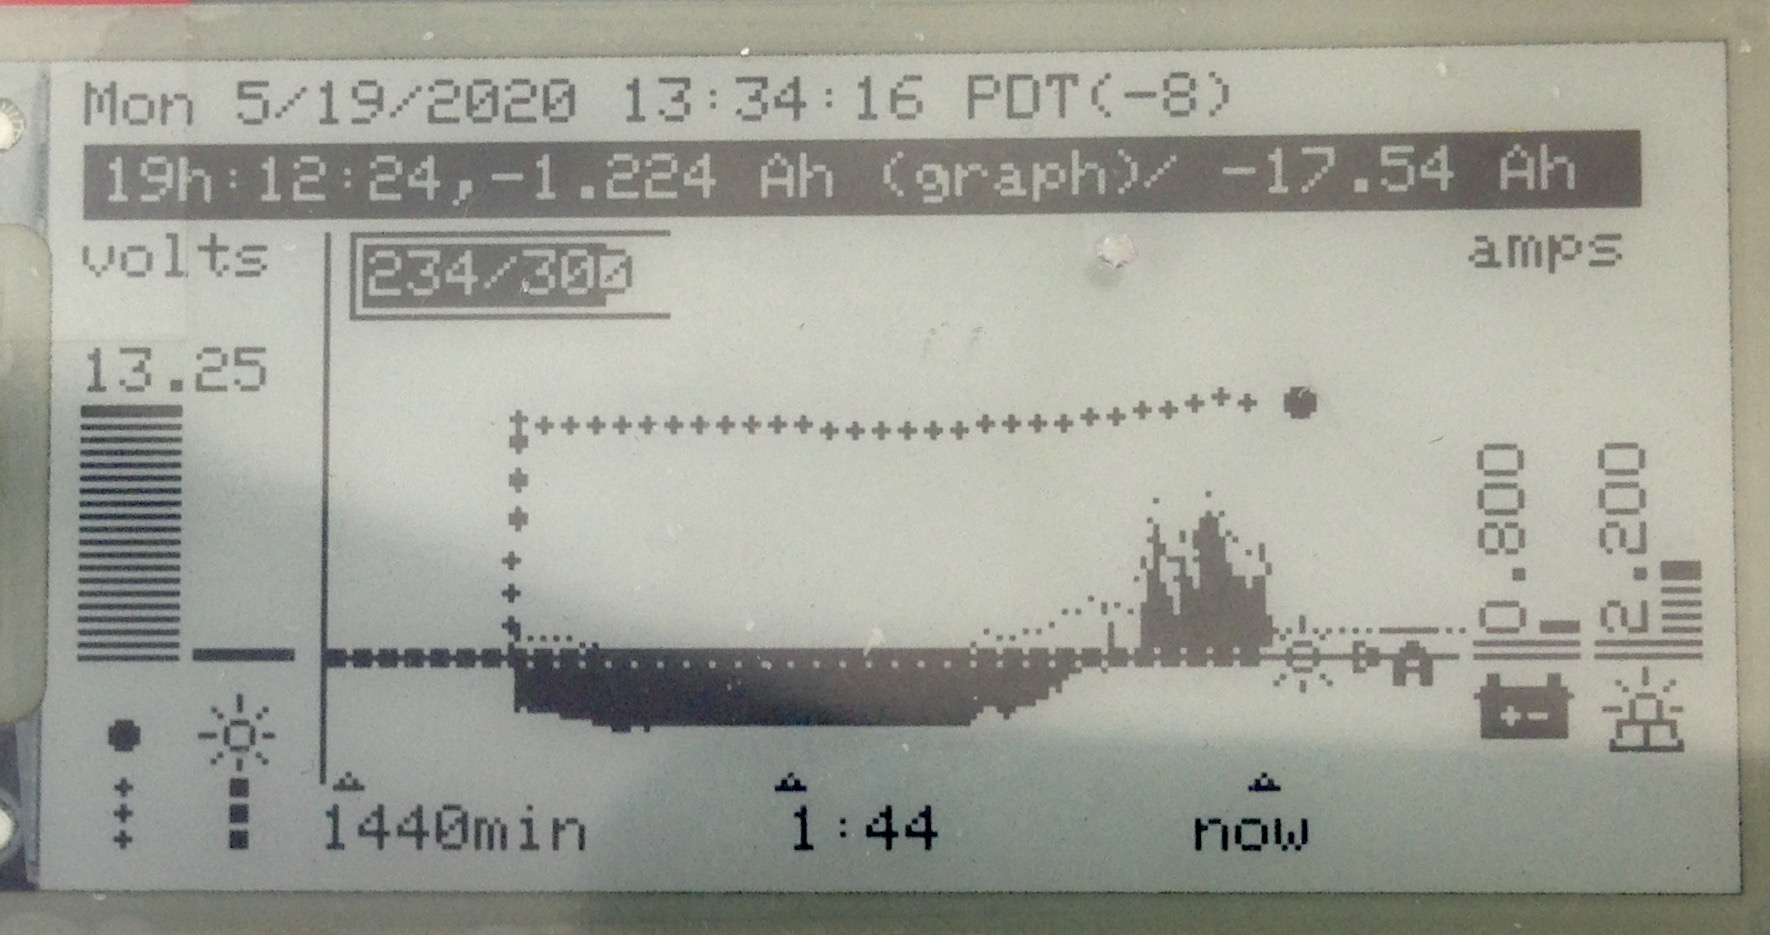
1. You want to read and display current and voltage level to and from a battery bank, charged by solar, and under a variable load.
2. You need to be able to download the readings at anytime, thru wifi.
3. It should consume very little power to add to the load burden.
There are plenty on inline ammeters and voltmeters with digital displays on Ebay. None of them have ports to get digital readings of the value they display. They fulfill requirement #1 and #3, but not #2.
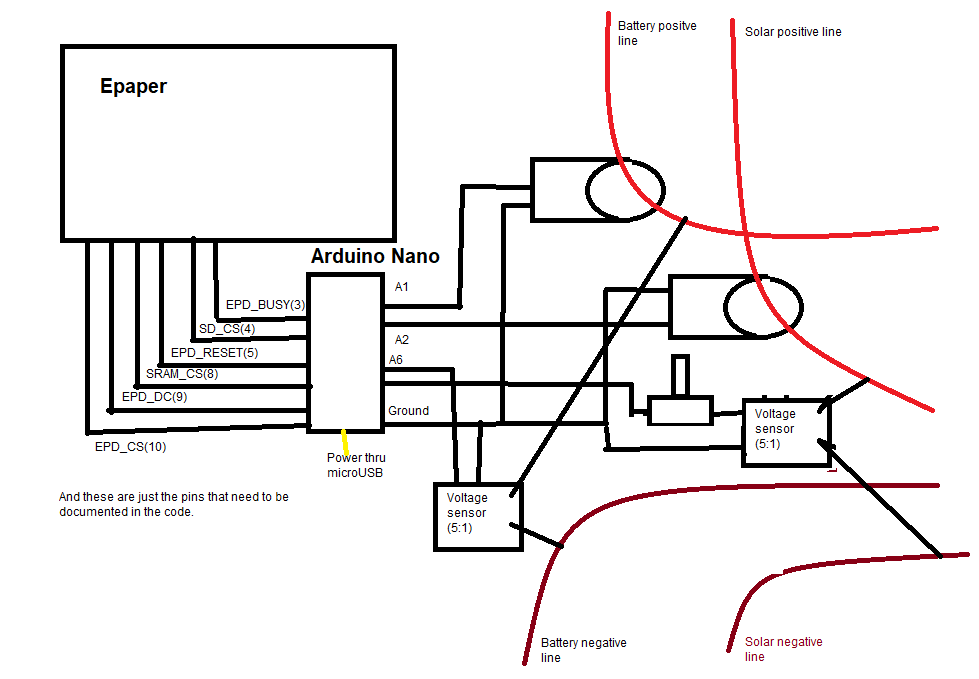
Assuming there is no solution for all 3, I hacked up a solution to #2 using an Arduino. Arduino has 8 Analog pins to read a analog voltage. 2x will be used to read the 3.3v logic from the current sensors. I hacked the current sensors to see if I can read the data it sends to the displays and they return an analog voltage between 0 and 3.3v and 1.676v being zero volts. Perfect, for the late Arduino models that run on 3.3v logic. You may have to calibrate your code to what your sensor returns, depending on your situation, like wire length to sensor, or faulty sensor. 2x analog pins will be to read the voltages from the battery to ground and solar voltage to ground, which has upper voltage of 14.5v and 19v respectively. Early Arduino’s analog read pins can accept 5v logic, but Arduino 3.3 (there is 33 in the name) can only read voltages up to 3.3v. Pre-built 5:1 voltage dividers are available to reduce 16.5v to 3.3v. These are advertised on Internet as Arduino voltage sensors. I’d rather buy from expert than make, unless it’s fun. Voltage dividers aren’t cool, and it sure beats figuring out which resistor size to use as voltage dividers, so that it doesn’t a lot of power, but the Arduino can still read the voltage. The line to the battery should only go up to 14.1v, when charging. 14.1/5=2.8v should be well under Arduino 33 model’s analog read max of 3.3v. However, the Solar panels have a higher voltage range up to 19v. If you want the Arduino to read that voltage, you need a higher divider. A potentiometer will give you a variable voltage divider with a knob, so that should work (assuming the total ohms match that of the voltage sensor). I added a potentiometer inline with the voltage dividers, to create a voltage divider, with a 5:1 floor. 6:1 will give you up to nearly 20v, which will be safely divided into Arduino’s range of 3.3v. Pick your potentiometer max ohm, based on total resistance of the voltage dividers, so you can figure out the max range you can add.
That leaves 4x more analog pins, if you want to have extra sensors like a temperature sensor.
The Arduino, however, has very little RAM. Though you can add Wifi capability to an Arduino, and I’ve chosen one with Wifi built-in, all by itself, it can only return the up to moment, current and voltage readings. I wanted a little more than that. The Arduino Nano 33 Iot has both Wifi built-in and 16Kb of RAM. Which should give me 24hours of voltage readings stored, but not more.
Still, I wanted a little more than just a text download of 24hours of sensor readings. I can’t analyze the Solar output on just 24hours of data. So parse these words in your mind very carefully: Scope creep is only your enemy when your time is money. So I added code to a Linux server to ask the Arduino for it’s voltage and current readings and store it on a database, and when I want to see them on a nice graph, I load up a webpage served from Apache. I assume you have some experience using Linux as it’s free on the Internet, and all you need is a free computer or a Vmware virtual instance of it. And that you know how to install the open source Apache, and MySQL databases, on Linux.
As long as the Arduino is Wifi capable, the Linux server can be on mains power, as long as it’s on the same network, and read from the Arduino. And requirement #3 is still fulfilled.
Still, I wanted more. Homespun code is notoriously unreliable. What if the Arduino likes to crash a lot. How will I know when it crashed? What if the power goes out? So I added a E-paper display, that will show last 24hours of data. Even if Arduino crashes, the last graph will show the data and time and date of it.
Hardware you need:
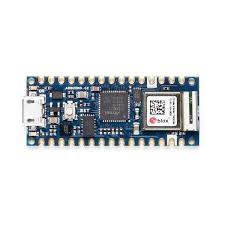
Arduino Nano 33 Iot (Lots of RAM with built-in Wifi)
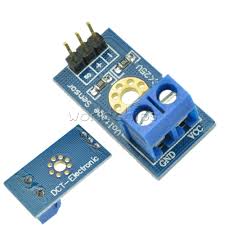
2x 5:1 voltage dividers (To reduce 12v to 3.3v range for Arduino to read)
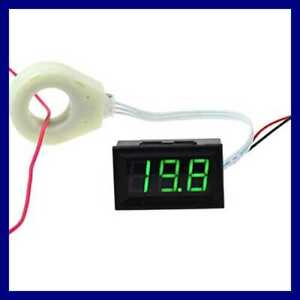
2x Current sensors (Your choice, I picked closed loop hall sensors, but they pick up false readings all the time).
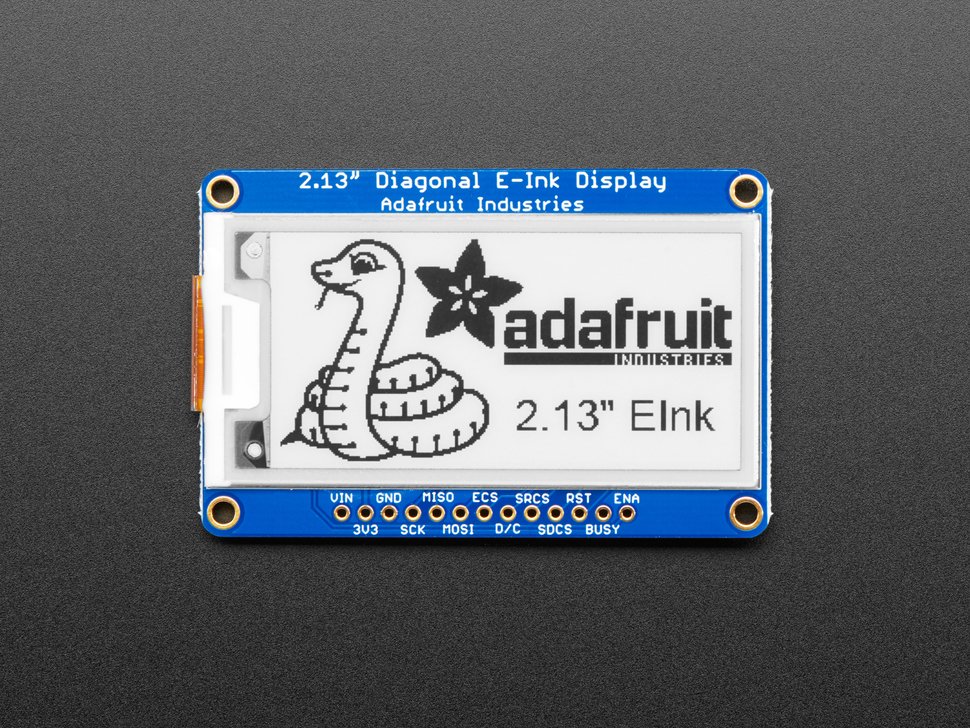
E-paper display (So you can see, when your project crashed)
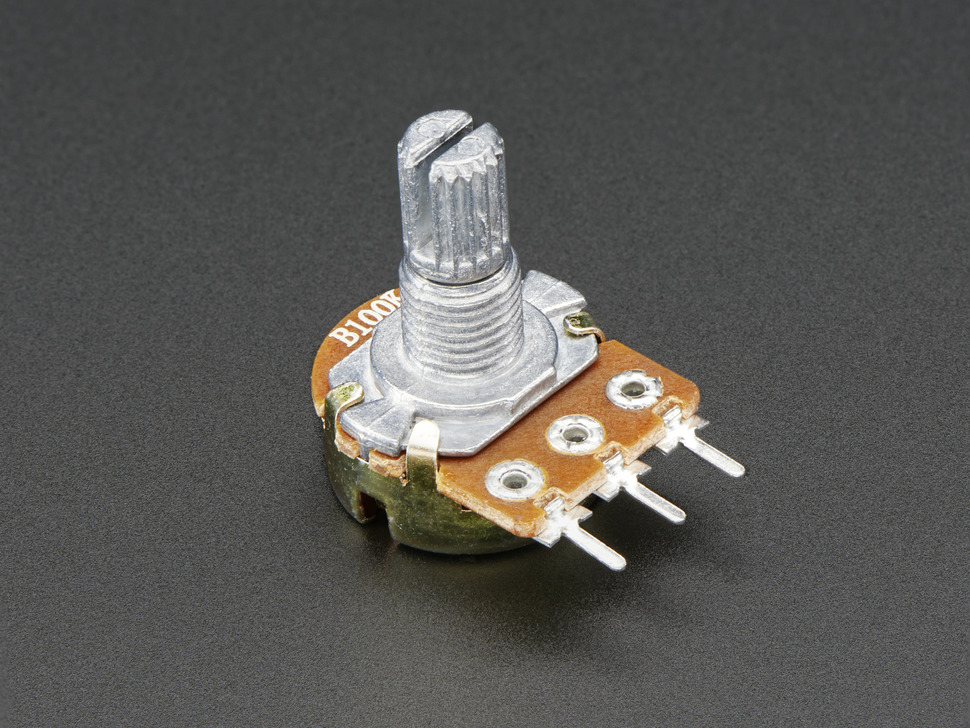
Potentiometer (so we can adjust the voltage divider ratio, or in combination with another voltage divider, use the variable resistance feature of potentiometer)

A PC with a linux distribution on same network as Arduino (I used Lite Ubuntu), for free database and web server
I did spell out in the synopsis why you need the hardware above, right?
Software on Arduino
If you want to get hands on, you need to buy a Arduino Nano 33 Iot, buy the Epaper display and connect to Arduino, download the IDE, clone the project code from Github, load the “VanPowerMeter.ino” in ArduinoCode folder, connect your board to your computer, load the libraries and compile.
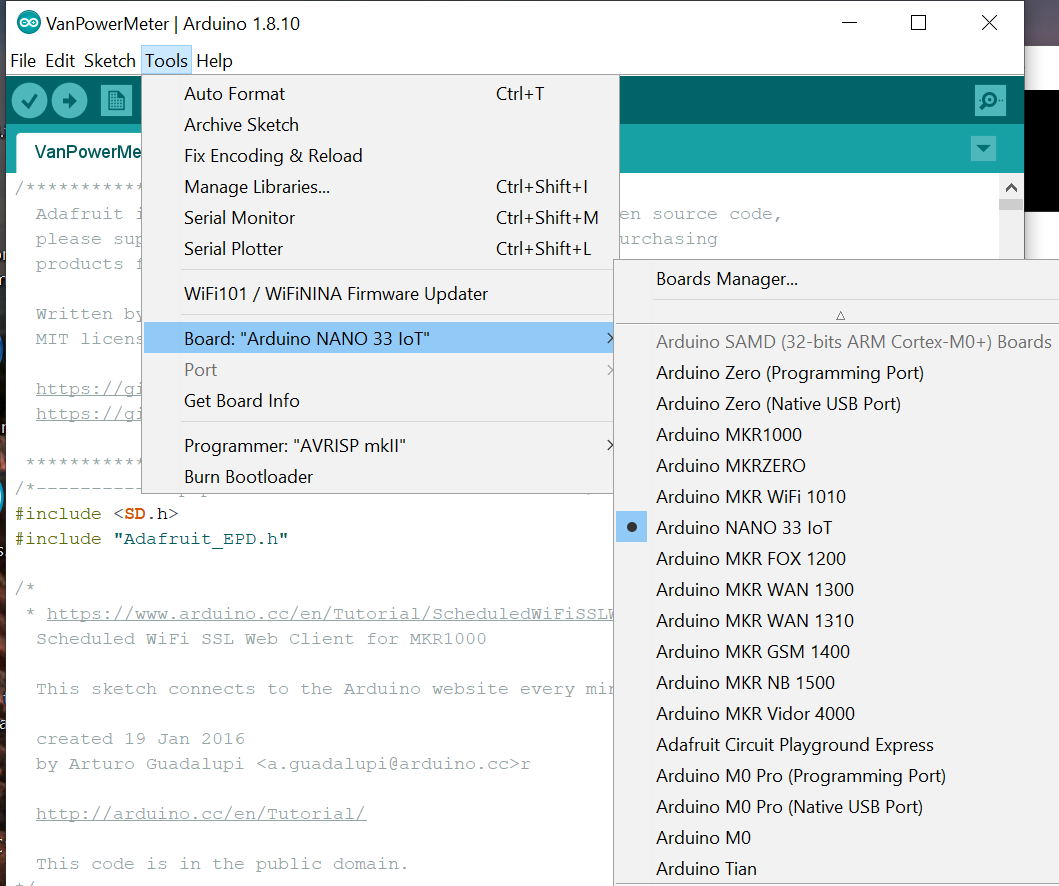
Normally plugging the Arduino in, the IDE autodetects, but if you want to see for yourself that the board is correct
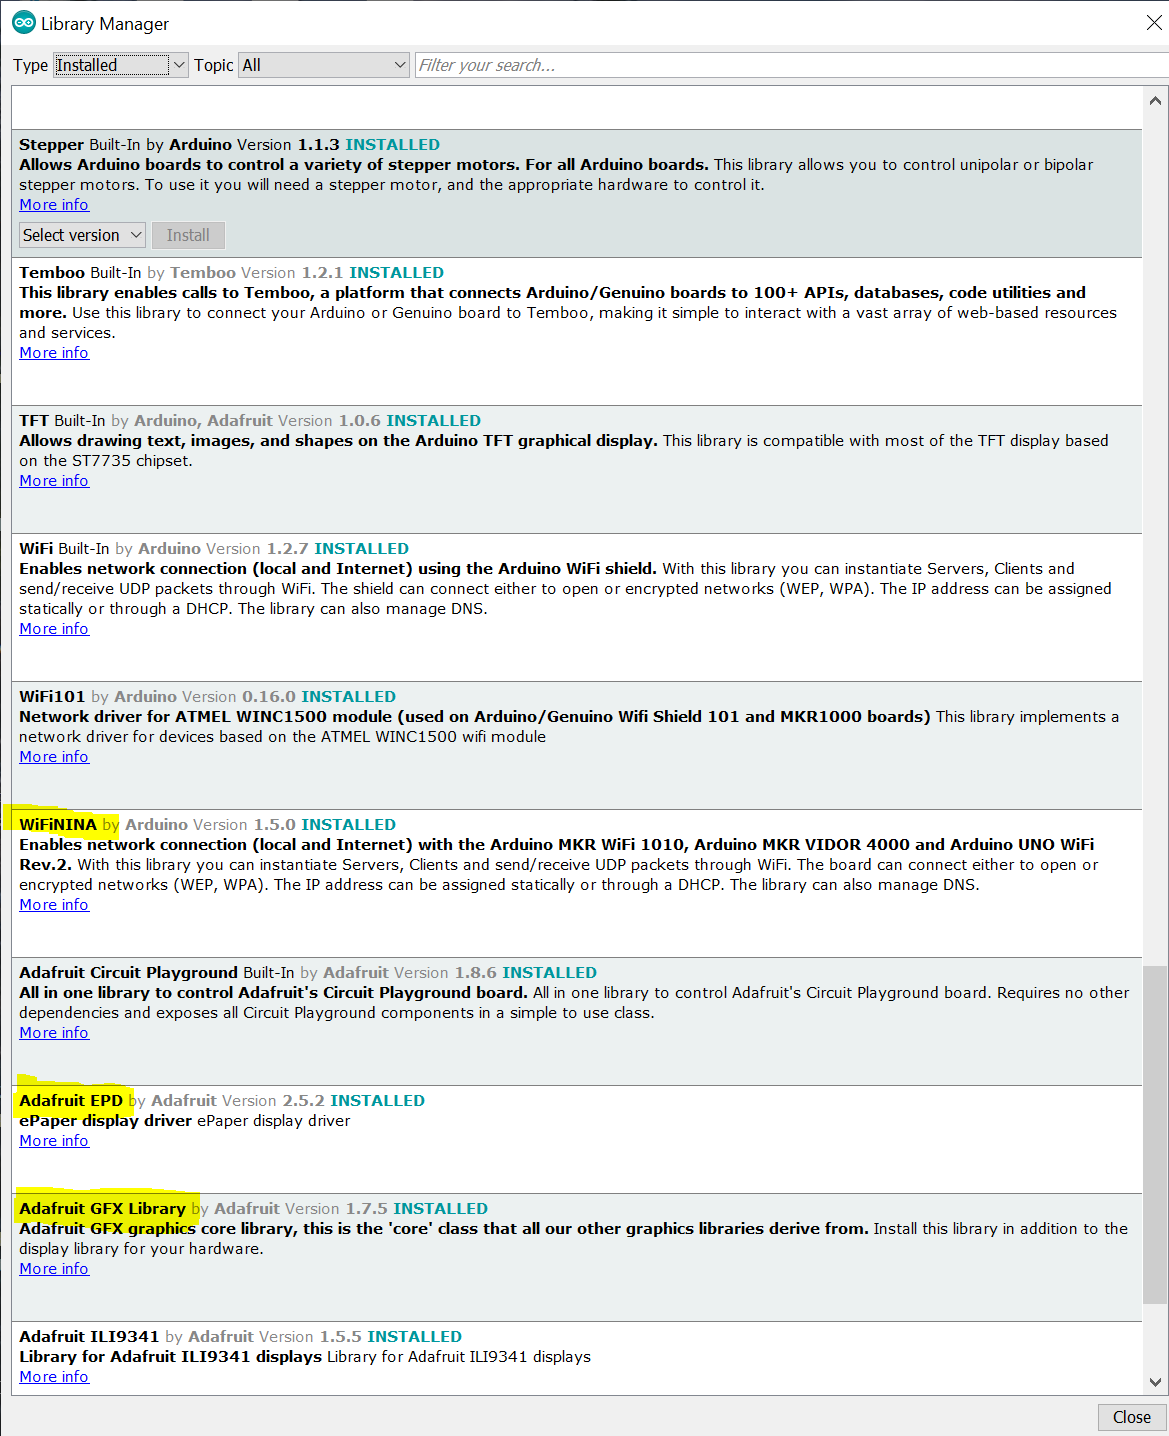
The Library manager allows you to automatically download libraries uploaded to Arduino. Epaper display is one of those. So is WifiNina.
If you plan to have Arduino connected to a Wifi network connected to Internet, you may not have to do anything to the Arduino code. Just change the Wifi name and password in arduino_secrets.h, compile and upload to the Arduino. And if the e-paper display is connected correctly, you should see a immediately a splash screen with version number. Next shows the IPAddress your router gave the Arduino, then the time received from the NTP time server. If you’re not on Wifi network connected to Internet, then it will show the 192.168.1.200 IP address that the Arduino will assume from now on. And finally:
If you want the Arduino to have a static address,
change the configureNetwork() function.
WiFi.config(IPAddress(192, 168, 1, 200)); //<- static IP
is the line that tells it to hardcode the IP Address, if it's not connected to internet. Copy the above line of code, under the code below.
if(isInternetConnected)

  timeServer = nistServer;
and add braces to the if block. Change the IP address to your purposes.
If the E-paper display isn't showing anything,
recheck your connections match the Arduino code's understanding of which of it's pins correspond to pins connected to Epaper display.
#ifdef ARDUINO_SAMD_NANO_33_IOT

  #define EPD_DC      9

  #define EPD_RESET   5

  #define EPD_CS      10

  #define SRAM_CS     8

  #define EPD_BUSY    3

  #define SD_CS       4

#endif

Adafruit_SSD1675 epd(250, 122, EPD_DC, EPD_RESET, EPD_CS, SRAM_CS, EPD_BUSY);
For pins not documented, re-check the generalized installation instructions for the e-paper to Arduino.
If you want to make more changes than that, the Arduino programming model is simple. One method (setup()) that runs once at beginning, and another method that seems to be executed repeatedly (loop()), and never stops. The Arduino programming model does not have a exit program transition. It should run forever, until it crashes.
E-paper hardware is handled by the e-paper Arduino library (GFX & EPD) provided by Adafruit. All of the digital pins are occupied by the epaper display. Which is good bc I didn't have a need for turning on a light or fan using Arduino. And I hate things going to waste. This library can be downloaded with the library manager. Reference the library at top of code file, so it will recognize the functions. Call library routines to draw on the epaper image buffer. If you wish to see the source code for the Adafruit Epaper libraries, it is on Github.
The Wifi hardware on the Arduino Nano 33 Iot, is accessed using the WifiNina library. Most of the other separate Wifi boards that are add-ons to other Arduino microcontrollers models without wifi, seem to be driven by the Wifi library. The function names seem exactly the same on both Wifi and WifiNina libraries, they just call different implementations. Don't ask I know this...
The Arduino Nano 33 Iot has an odd design which the SSID is stored in a separate .h file for the Wifi SSID and password. Almost every implementation I've seen on internet, has this password hardcoded in the code. I truly do not know if this provides extra security from taking the password from the Arduino, or if it's just a way for Senior developers to organize code, so junior ones don't check in Wifi passwords into source control.
The loop constantly runs without delay, to take sample readings from the analog sensors and averages them. The analog pins are 12-bit ADC, which means it returns a value from 0 to 4095, which corresponds to a voltage from 0 to 3.3v. However, the 0 to 4095 value is stored in a variable of defintion struct analogsamplesum, and the total and sum is kept there, to be averaged later. The code below in loop(), will read as many readings as possible, without overflowing the int variables in the struct analogsamplesum.
struct analogsamplesum amperes = amperesForWeb = getsample(A1, fudge_for_ammeter2, &ANALOG_VOLT_TO_AMP);

  struct analogsamplesum voltage = voltageForWeb = getsample(A6, fudge_for_voltameter, &ANALOG_VOLT_TO_12V);

  struct analogsamplesum solarA = solarAmpForWeb = getsample(A2, fudge_for_ammeter, &ANALOG_VOLT_TO_AMP);

  struct analogsamplesum solarV = solarVoltForWeb = getsample(A7, fudge_for_voltameter, &ANALOG_VOLT_TO_18V);
To get a reading, an average is created from the prior variable, and the estimated voltage from the sensor is derived. Each sensor output voltage will correspond to a voltage reading or current reading from a sensor. So a variable of the definition struct linearconv, will hold the conversion from volt read by Arduino, to the corresponding units that is documented for the sensor. The lines above take less than a second to execute in total, but the average is supposed to be for an entire 10min interval and the variable is already close to overflowing. First, the samples above need to be included in the interval samples:
inclInAvg(&eresMinuteTot, amperes);

  inclInAvg(&voltageMinuteTot, voltage);

  inclInAvg(&solarMinuteTotA, solarA);

  inclInAvg(&solarMinuteTotV, solarV);
But to keep it from overflowing the variables that store the sum of the samples, the code constantly checks if the values are in danger of overflow and does an adjustment
if(amperesMinuteTot.count>=sample_count) reduceToAvg(&eresMinuteTot);

    if(voltageMinuteTot.count>=sample_count) reduceToAvg(&voltageMinuteTot);

    if(solarMinuteTotA.count>=sample_count) reduceToAvg(&solarMinuteTotA);

    if(solarMinuteTotV.count>=sample_count) reduceToAvg(&solarMinuteTotV);
The adjustment above will skew the average, so that it isn't a true interval average, but since I don't expect the values to change that much, it shouldn't have any real effect. A better way of handling it, is to keep the weighting of each sample the same. To keep from overflowing, the code averages the later samples at a greater weight than the earlier ones in an interval (10min).
At end of 10min, the arduino will update the history and the epaper display. This is one of the things it does in the if block for
if(millis() - samplesetMillis > 60000 * MIN_PER_GRAPH_PX)
*If you see variables called fudge, those are actually calibration variables, in case the readings aren't exactly centered as expected, for a variety of unknown reasons that can be mitigate in software.
At beginning of each loop, it checks if there is HTML request that has come in, in httprequesthandle();. If it has, it serves that request, then goes do its analog sensor readings again. It really isn't meant to do a large loads of HTTP requests.
It also checks if there is a S-NTP request in handleNTPOn123(), though truthfully I can't think of a reason I want to use that feature right now. The Arduino checks with a NTP server for the current time. It will share the time, thru the SNTP protocol. It can basically be a NTP server.
And every day or so, it will call a S-NTP server for the current time, thru the ntprequest() method. It uses code from RTCZero library to set time. The Arduino's RTC-Zero library on the way it keeps time, seems to have a drift of about 5min every day. There is no clock hardware on Arduino to keep time, or to keep track of it when unpowered.
There is code to make HTTP or HTTPS requests to a webserver. However, bc of limited buffer space, there is only so much it can do with that HTML it loads. The current routine only loads an very small image at beginning in setup(), from a webserver, to draw on epaper.
* You may notice the average routine has an odd and probably incorrect method of dealing with overflow on the averaging the sensor readings, routine. All I can say is that it's close enough for a human eyeball who just want to know within a tenth of a amp or volt, what his battery status is.
Interesting things you may not have thought of
Soldering
The Arduino Nano doesn't have pin headers. At least the version I bought doesn't have the headers pre-soldered on. At least this gives you the chance to learn to solder, right? Maybe by time someone reads this, they sell a version with the pins already soldered on.
RAM
Ever thought an array of 144 elements was pretty much the biggest you can have? I have to tell you. I never even considered it might be a problem. Arduinos have very little RAM. Consider if you want to store
DateTime (32bits+16bits+8+8+8+8+8 for epoch, year, month, day, hour, minute, second),
battery voltage(16bits),
solar voltage(16bits),
battery current(16bits),
solar current(16bits)
Total 19bytes
x144 elements
2736 bytes (or 17% of 16k)
That's static allocation never available for the stack, or dynamic buffers (which I don't use b/c I think it's less unpredictable allocating that much memory on the stack).
Memory leaks. The arduino programming model has a heap the grows backward from end of memory space and stack that grows forward from beginning of memory space. So I suspect when it runs out of memory, it doesn't tell you. It just starts overwriting stuff that was there already. Plus the heap can't shrink, if you store pointers to things like strings in global scope. Hell, I'm not even sure if the references are only in local scope, that the pointers are release properly for a string.
|0kb         |1kb                 |13kb         |16kb
|__Stack____>                    <-----Heap-----|
|__Stack____<====================>-----Heap-----|
             Shit overwritten here
Buffer overflow. Yes, you have to deal with this. You shouldn't use it with anything mission critical, if you're not used to coding anything where this is a concern.
|Start of heap    |Start of Array   |ADC to amps coefficient|
|                 HiHiHiHi          1/1000                  |
You overflow your array...
|                 HiHiHiHiHiByHiHiHiHi1000                  |
And now the number you used to multiple your ADC readings with, to get amps, is now 72/1000 (H is 72 in ascii).
** Please don't be too literal about your interpretation about the characters representing bytes in computer memory, if you've taken computer science hardware classes. The figures above are meant to be figurative. No one is going to understand 0x01 is 1 in a int variable type stored in binary memory, while "Hi" is stored as 0x4869. My way, it's easy to see "Hi" overwrites the 1.
HTML is extremely buffer dependent. Receiving it and sending it. This is where you have to decide if the buffer space is dynamic or static. There is no such thing as multithreading on Arduino. It's a single loop. If you have a temporary buffer allocated on stack declared in a function call, you probably create the buffer statically in global scope to be re-used. I've read some programmers on internet do this, when there is an unexpected memory leak, and smaller repeated allocations on heap reduces the effect.
I created a 8k static buffer for HTML input and output b/c (this is going to sound stupid), I want to download a image off the internet to show as splash screen on epaper. Yes, that is a lot of space for useless information.
Old arduinos accepted 0 to 5v on input pins, but newer ones with 33 in name only accept 3.3v. The one I have has additional RAM and integrated Wifi, but only 0 to 3.3v on input pins. Put too much voltage and it might be an expensive fuse. Or short. I put 12v on the analog pin by accident and the Arduino basically became a short, channeling as much current as the power supply allowed (2A).
Sensor readings are extremely volatile. You have to average for an interval for a stable reading.
SNTP is a awesomely simple UDP protocol. I can read packet in a arduino to simulate a clock on Arduino. And I can create the packets, if I want to simulate a SNTP server.
Epaper display
Strangely the Adafuit library, doesn't give me an ability to access the "frame buffer" of the e-paper display, so I can't see what is on it. But it's drawing method of choice, seems to draw on an undocumented buffer using the library code. The library hasn't implemented a readPixel as far as I know. But has a series of writePixel() and drawLine() functions, which are drawn on the hardware only on the epd.display() call.
Epaper can only display monochrome. There are 2 routines to read monochrome BMP and draw it to the epaper. One is cut and pasted from Adafruit to read from a SDcard. The other will read the BMP loaded from a array buffer, to draw on the E-Paper display.
I have stored the history as pixel heights, so the calculations don't have to be redone.
int batteryamppxgraph[DATA_COUNT];
int batteryvoltpxgraph[DATA_COUNT];
int solaramppxgraph[DATA_COUNT];
int solarvoltpxgraph[DATA_COUNT];
//int graphactualmah[DATA_COUNT];
That is 144x64bytes (pixels of battery voltage, battery current, solar battery, solar current). You ask why 16bits, if the epaper display only has 122 vertical pixels, and 8bits can store up to 255? I draw from a virtual zero axis. And there is no negative 8bit datatype. So you have to do software 2's complement math, or go with 16bit int, if you want to draw -22pixels from an x-axis drawn on pixel row 100 on epaper.
Today, I believe that since I draw the e-paper only once every 10min, that I made a wrong design decision. Rather than storing the pixel values, I should just recreate them, since the penalty for doing so, only occurs once every 10min. Rather than take up the memory to store 144 amp and voltage readings translated to pixels.
If you don't want a display, the code really wasn't designed to easily remove references to a display. Yet, it should be easily done. Comment
addToGraph(amperesMinuteTot, voltageMinuteTot, solarMinuteTotA, solarMinuteTotV);
out of the code, as this line draws the graph. All references to the epd variable declared with
Adafruit_SSD1675 epd(250, 122, EPD_DC, EPD_RESET, EPD_CS, SRAM_CS, EPD_BUSY);
needs to be removed. Actually, removing the library references to the Epaper libraries by commenting the below lines
#include <SD.h>

#include "Adafruit_EPD.h"

#include <SPI.h>
will cause the code to not compile, and you just need to fix those lines that got broken. Compile successfully and upload.
Software on Linux
You're not numb with minutae yet? Ok. Up to now, you've only done the work to see 24 hours of data on a e-paper graph or to load the text from the Arduino web server. What if you want to do more with it? How about...
Sample of HTML to show data
The Arduino's limited RAM means it can only keep a very limited amount of history, in volatile memory no less. If power is lost, the e-paper will still show the last graph, but there is nowhere to download the readings from. Even if I started shaving off space from buffers, and removed strings from debugging messages with #defines, at most the Arduino can store about 5 days of data. It can never server the data in the page above.
To fill this gap, the HTML in most of the Arduino's web server capability, can double as CSV files. Which are more or less easily parsed by MySQL's "LOAD DATA LOCAL INFILE" command. Using crontab, I configure a bash script to be run every 10min to get data from Arduino. This is more than enough, since Arduino stores 24hours of data, but it allows the website to be updated live. The bash script calls curl to retreive the HTML, and saves it to a temporary directory. The script runs a series of commands to clean up the HTML into CSV, for the MySQL script to import. MySql (in a trigger, defined with the tables) reads the entire file, and picks out if there is any missing data, and inserts it in.
The same bash file run by cron that imports the data, also recreates the JSON files read by the Webpage showing live battery status. These are stored in the same directory as the HTML files in the apache directory.
The html file vanbattery.html is static. It's mostly javascript code, using the ChartJs library free on internet. I actually prefer server side scripts, as the programming model is much simpler (and therefore has challenges whenever you want to do something not so simple), as opposed to client-side scripting, but live updates or dynamic content generally need client-side scripting. It has a job running reading updates from the updated json files, and updates the ChartJs charts. This method works very well on chrome and I suspect firefox. It does not run well on edge or internet explorer, as it's HTML and javascript implementation is slightly different from the others. As a Javascript programmer, your job is to make sure your product works on a one of the industry standard browsers, despite your opinion of it. I just don't have the time to see if using JQuery as a abstraction library or custom code IE code will solve the problem on IE, and I will use the more virus-prone Chrome (the only browser I've gotten my settings changed by visiting a website).
To install, just install these software packages on your Linux machine. If you don't have linux, install it on a spare computer you don't need. Or download VMware workstation for evaluation, and download Ubuntu Linux ISO, and install it on a VMware machine. To install the software packages, run on linux, after logging in:
apt-get install curl
apt-get install 7z-full
apt-get install mysql-server
apt-get install apache2
bash should already by installed for Ubuntu and most linux packages. To install the tables for the database, find the file "LinuxCode\MySQL installation\createpowerdb.my.sql" downloaded from github. And upload it to linux. You can copy the code again to you linux machine by typing:
git clone https://github.com/studio-1b/Solar-Power-Meter.git
don't have git? install git with
apt-get install git
Once you've found the file createpowerdb.my.sql, type
mysql -u root -p < createpowerdb.my.sql
and it will create the tables to store the power readings from the arduino.
Now to put the data into the tables, you have to just run
pollpowerarduino.sh instant
pollpowerarduino.sh intervalaverages
pollpowerarduino.sh hourlyavgmah
pollpowerarduino.sh ntp
pollpowerarduino.sh calibration
to download the different data from the Arduino. To see this data, the way linux will download it, run
curl -S http://192.168.1.200/powerhistory
and you will see the 24hour data downloaded for "intervalaverages".
You're probably wondering if you have to run all of those yourself, every day. No, linux can automate that for you, using cron. Run
sudo crontab -e
and insert the lines from "LinuxCode\MySQL installation\crontab.sample.txt", change the path to correspond to where your pollpowerarduino.sh exizts, save, and exit. It will schedule a download every 10min for the most commonly retreived data.
Now you're probably wondering how to see all that data you're downloading. Well, when the pollpowerarduino.sh is finished, it creates a new file full of the data you downloaded into /var/www/html. This is the default directory that Apache serves files from. These files end with .json extension.
If you're familar with cron, you probably are asking if the "sudo" is necessary in "sudo crontab -e" step. Well, the process uses "loginmysql.conf" to login to MySQL, but needs to write to /var/www/html. And usually a normal user doesn't have permission to create files there. If you want to use non-root cron, you can create the files yourself
sudo touch /var/www/html/latestintervalavgs.json
chmod 666 /var/www/html/latestintervalavgs.json
for all the JSON files in "LinuxCode\HTML", so a non-root user can overwrite the files.
Those JSON files are used by the javascript code in the HTML page vanpower.html. Copy all the files in "LinuxCode\HTML" to /var/www/html. If you didn't use sudo for crontab, you may need to run chmod again on the JSON files. goto your browser and type in
http://192.168.1.201/vanpower.html
It will load the HTML page, which will then load the ChartJS libraries from the files you copied, and then load the JSON files to copy data into those charts you see.
The page should update every 10min. Which should pick up any changes the cron job updated to the JSON files.
Understanding sensors
Reading voltage
For the Arduino, it's relatively simple thing. It has 8 ADC pins, marked A1 to A8 (or was that 0 to 7?). When you connect a voltage source to these pins, it can read the voltage compared to it's ground. Ie. electricity is trying to go from the pin to the Arduino's ground, and Arduino is measuring how hard it's pushing. The sensor itself usually needs a steady source of power, hence it needs it's own + and - terminals.

The "voltage sensor" is a little different. It really doesn't need a active power source to power electronics. It is completely passive. It divides the voltage between a power source's + and - terminals, and the result is fed to the Arduino. Where the arduino measures how much this divided pressure tries to get to it's ground.
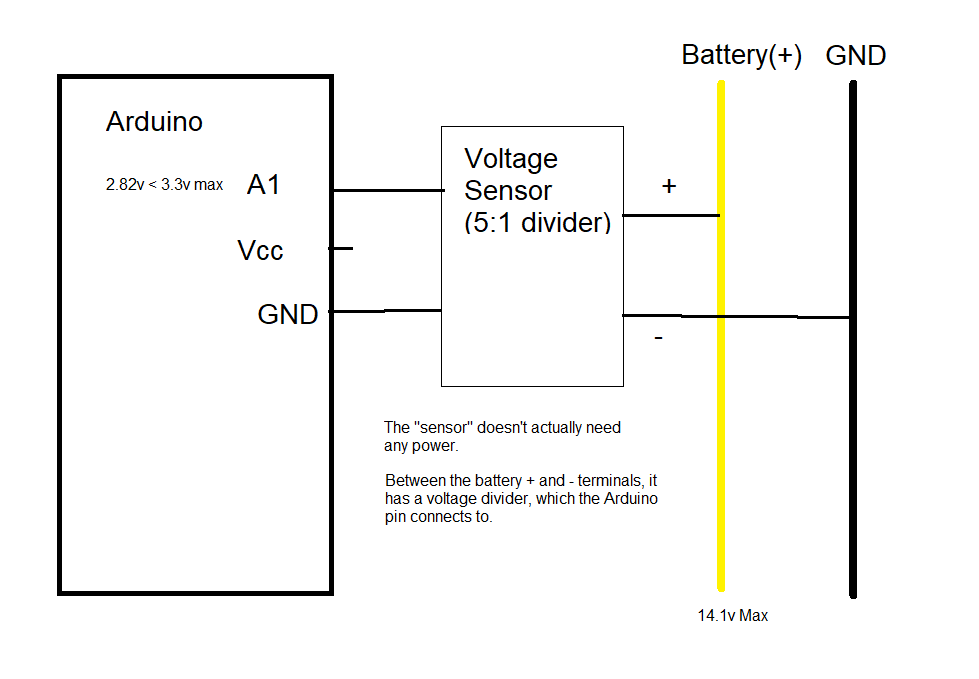
Potentiometers are variable voltage dividers. They have a knob you can turn. But they can also be used as variable resistors. If you need such a device. In my case I use a potentiometer inline with a voltage divider, advertised as Arduino voltage sensor. Reason being is (assuming it's a typical voltage divider):
(+)-----Resistor1---+---Resistor2------------(-)
                    |
                  Divided voltage-----------(-)
It's the ratio between the resistors that determines the dividing number, fore the reduced voltage. But you see the resistors are inline with the power source. That means it's gonna consume power based on equation V=IR. Small R means a lot of power consumed. I assume the guy who build Arduino power sensors knows the optimal total resistance for the divider. But he doesn't advertise this total resistance number. I have to measure it, so I know how much of a potentiometer resistance to buy.
Even then, I can turn the knob the wrong way and poof, the Arduino gets 10v bc the potentiometer is set to 5/6 and not 1/5. So at used the variable resistor feature of potentiometer to create a floor.
(+)-----Potentiometer----Resistor1---+---Resistor2------------(-)
                                     |
                                   Divided voltage-----------(-)
This is how a 6:1 voltage divider ratio is created, with a limit that a person can't accidentally change beyond 1/5.
Reading the current sensor
Depending on how you sourced your current sensor, you probably have a datasheet that tell you that if the sensor returns 1.5v that's zero amps, and 1.6 volts, that's 1 mA, and 1.4v, that's -1mA. It's likely just like the first "generallized" sensor documented above.
In my case, I couldn't find a Hall effect sensor for current on ebay. Seriously, it was a bad week. So I got a digital ammeter and hacked the sensor reading it was displaying. I found out what the ground line was on the sensor by using a multimeter between all the signal leads and GND. Anything that had a steady 5v or 3.3v, I assumed was power and gnd. Anything that variably changed between 3.3v and 0 depending on current change, I assumed was signal. And I measure the voltage change depending on what was measured. My datasheet is a excel spreadsheet of measured current vs voltage from signal.
Debugging the live Power Arduino
If it's connected to a wifi network, when the Arduino boots, it will show the IP Address on the E-paper. I hope you still have an e-paper. Bc if you don't, you're gonna have to sniff your network to see which IP address was given to the Arduino.
Goto your web browser and type "http://[IP Address of Arduino]/live" and it will show the translated reading values. By default, the A1 and A2 pins read from current sensors, so it translates 0 to 3.3v, between -50 and 50 amps. And A7 and A8 pins it assumes reads from the voltage sensors and translates 0 to 3.3v to 0 to 16.5v.
You can see the raw ADC number on each pin by going to type "http://[IP Address of Arduino]/adc". This will show you each pin and a number between 0 and 4095, which represents a voltage measured on the pin between 0 and 3.3v.
This is one way to debug what is happening on the Power Arduino when it is live.